
Ask your buildings anything
Kaiterra AI turns your indoor environmental quality data into answers. Ask a question in your own words, and get a clear response from your own devices. No dashboards to learn. No spreadsheets to export.
You have the data. Getting answers shouldn’t be this hard.
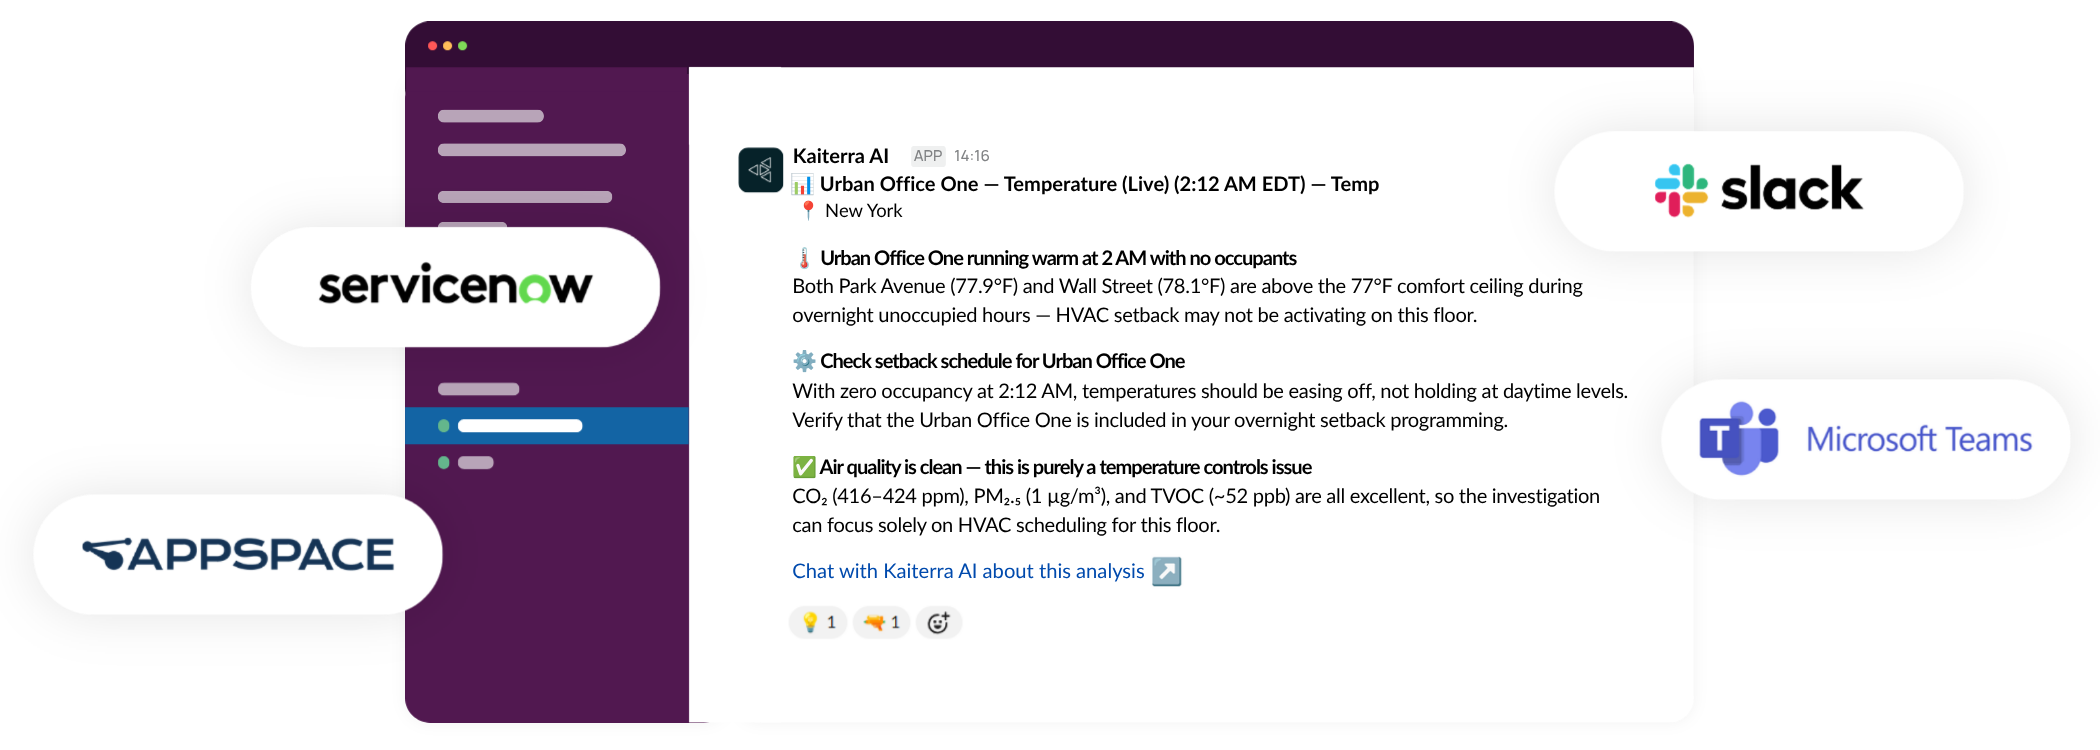
Prefer to work inside your own AI tools? Bring Kaiterra data into Claude, ChatGPT, Gemini, Cursor, and more.
Closing the loop for building performance, simply by chatting
Understand, diagnose, report, and share, all in a single conversation. Issues get resolved faster, your team gets support, and occupant experience improves.
See Kaiterra AI in action
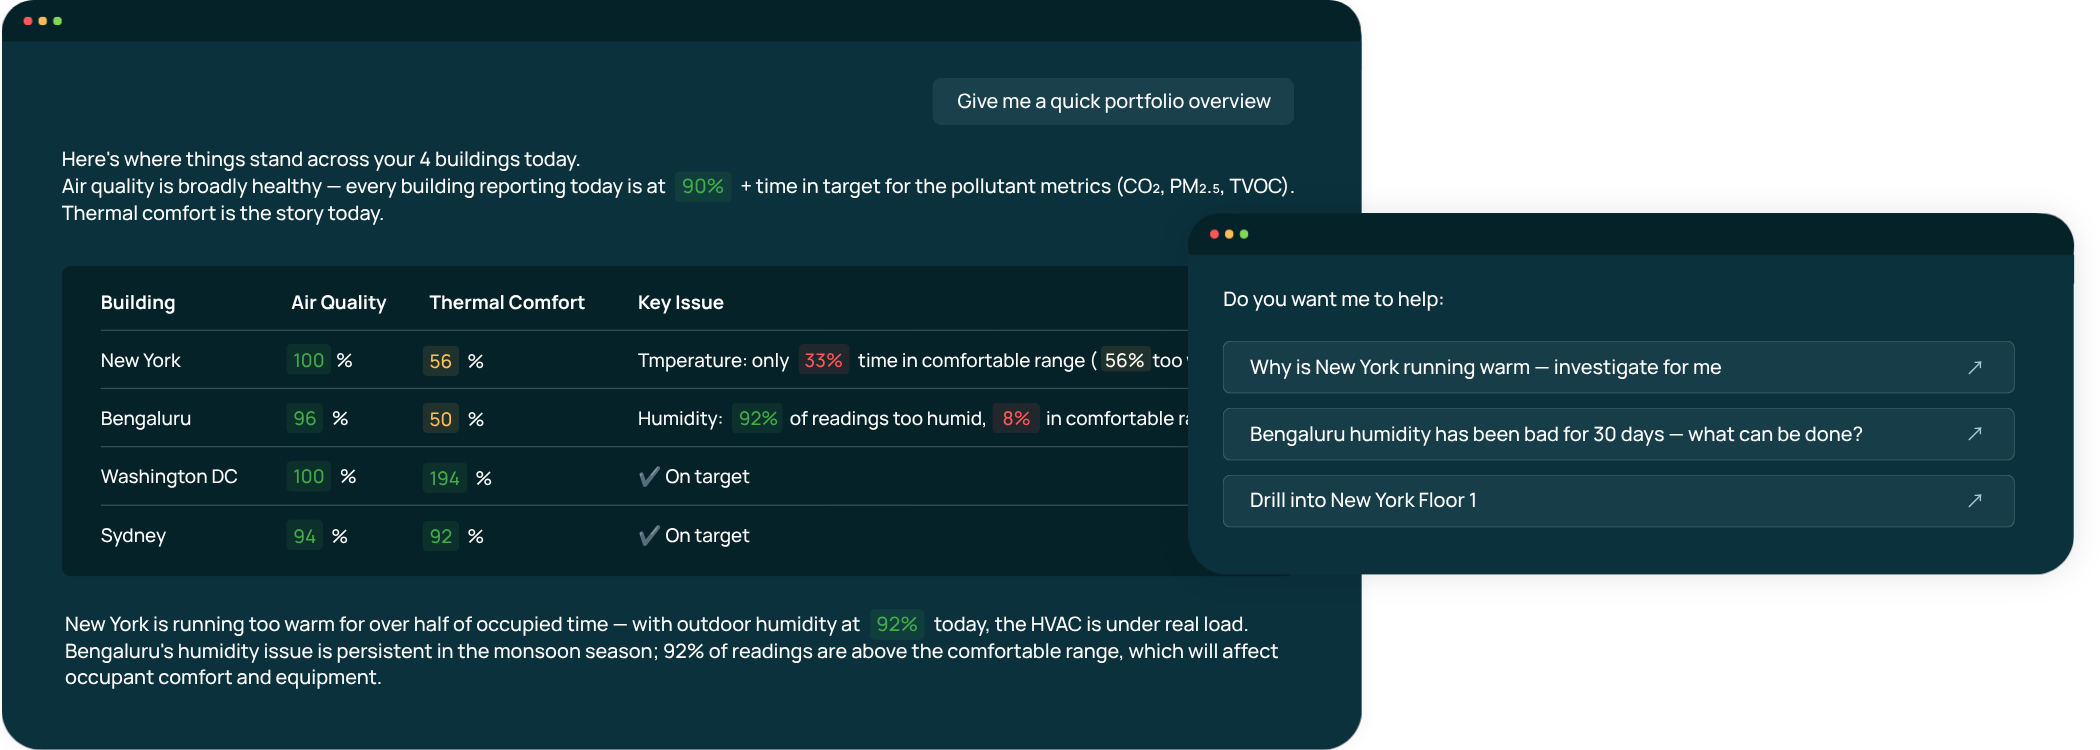
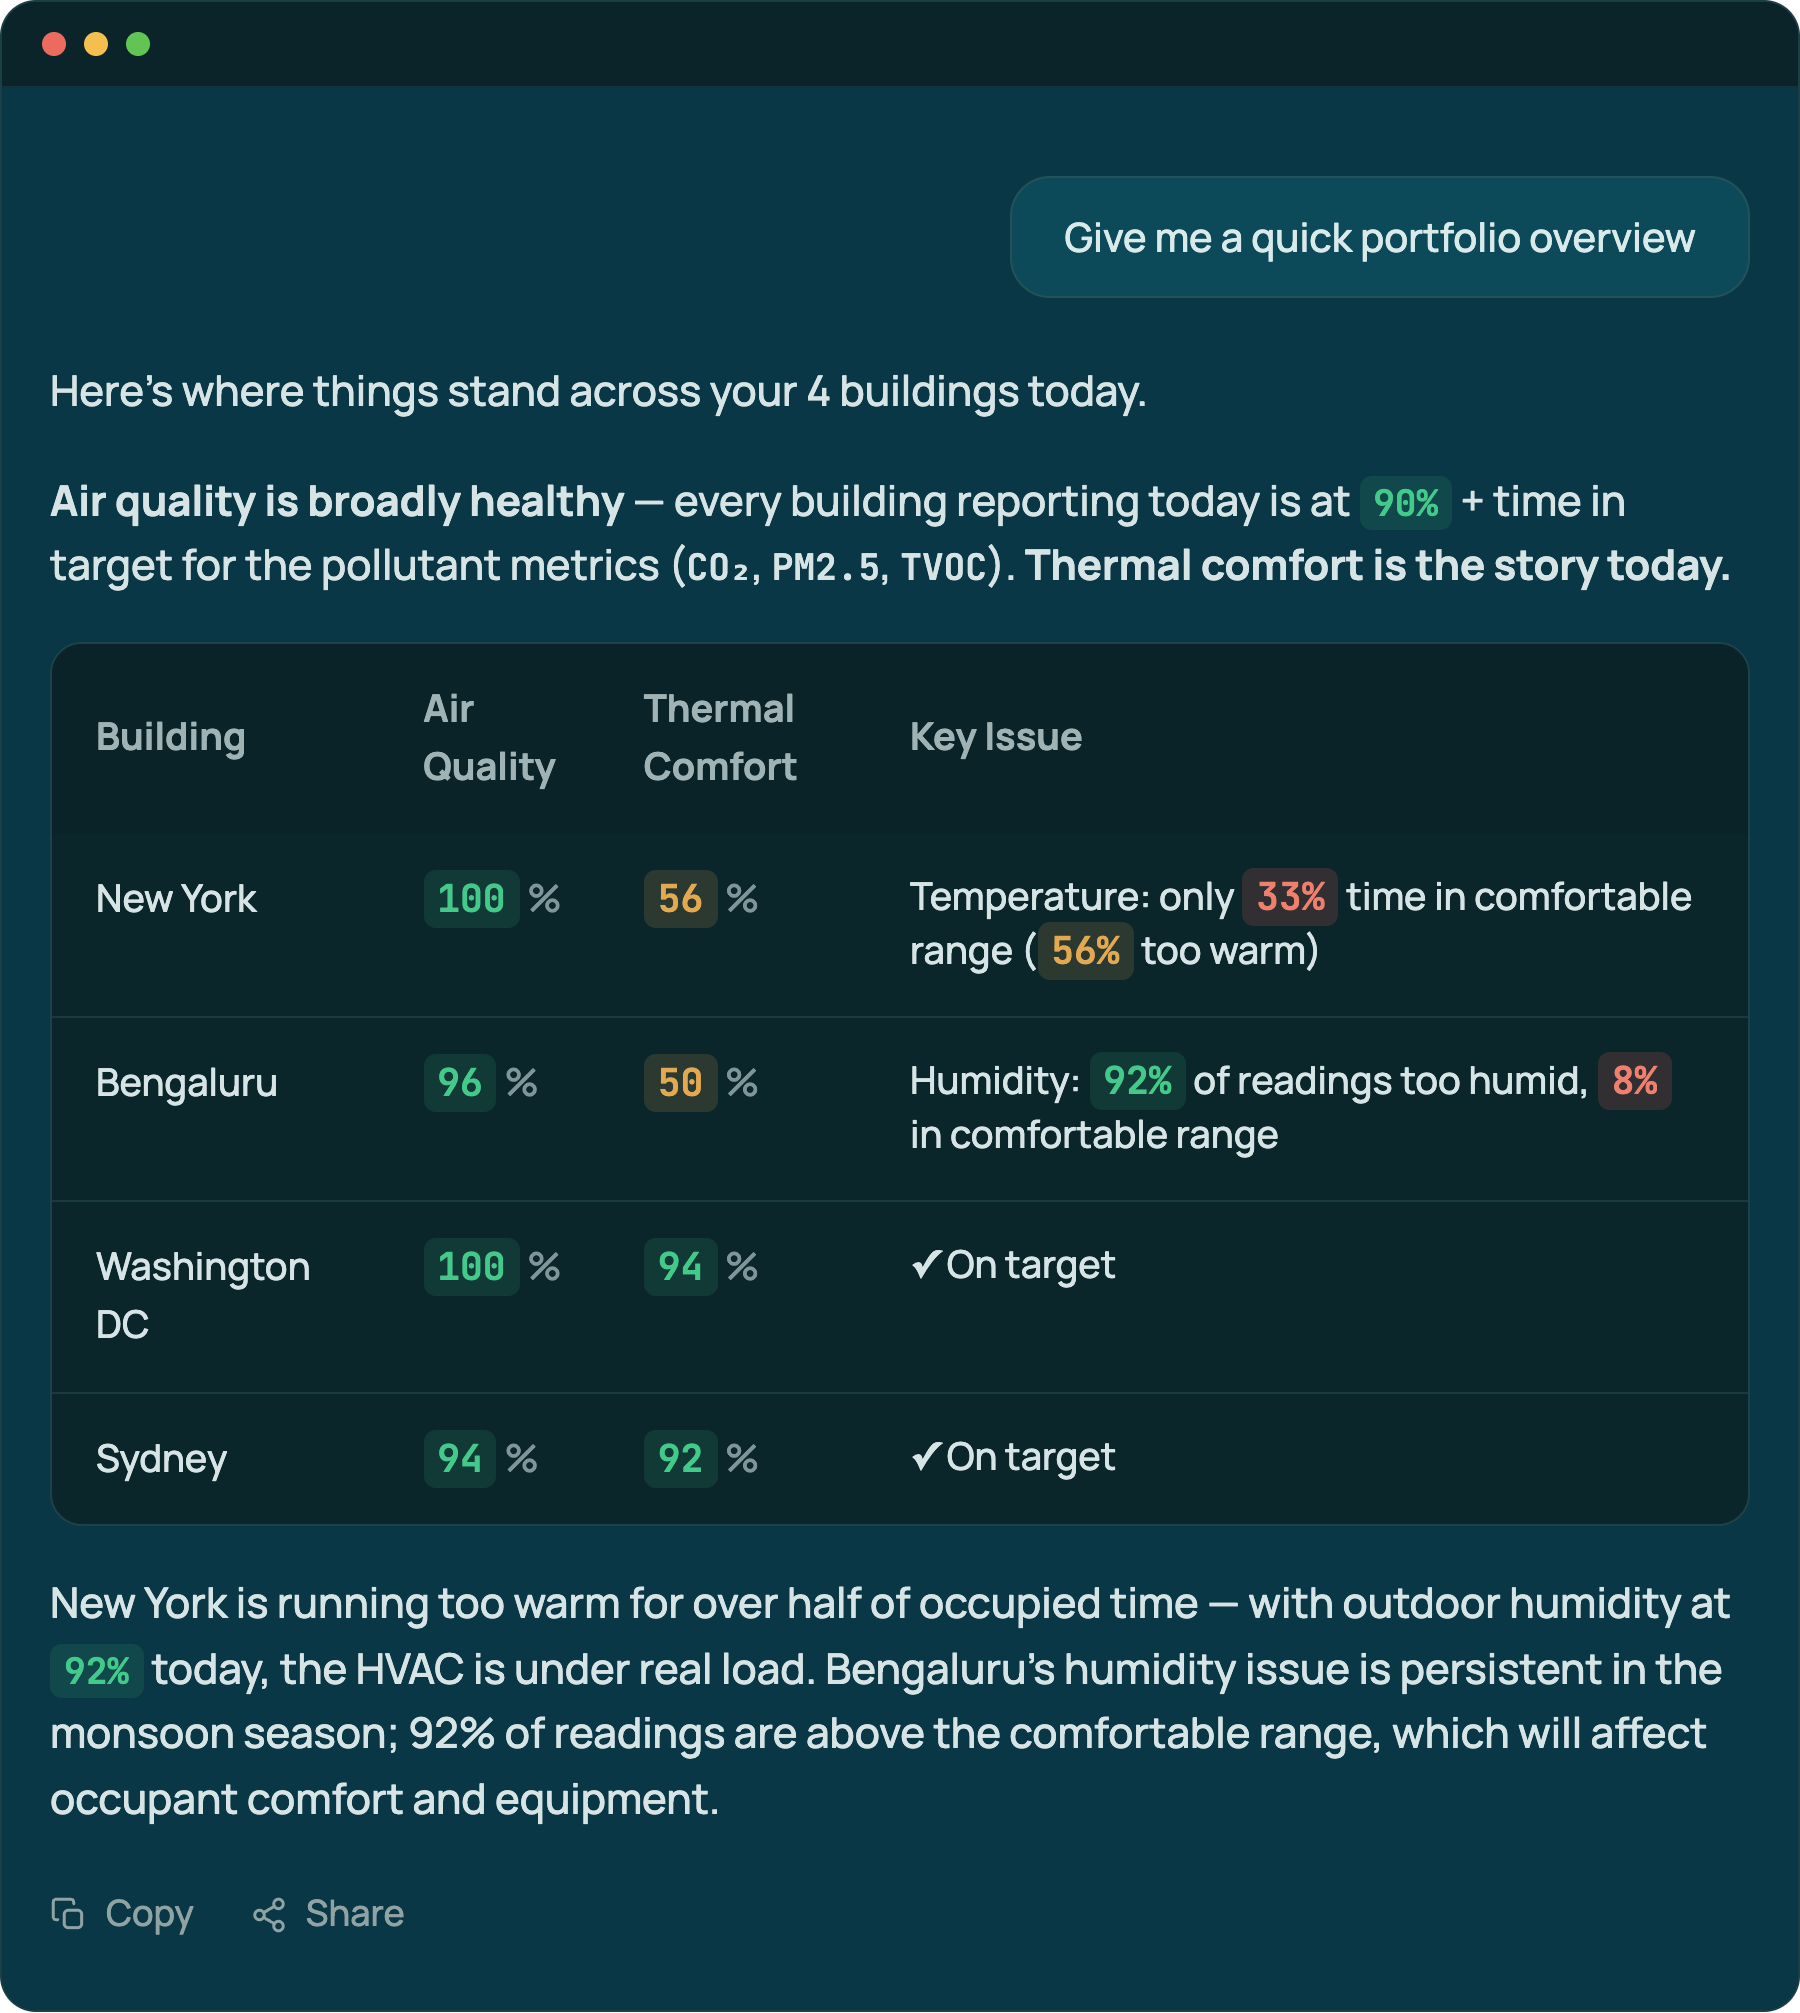
You don't have to toggle filters and tabs to know your air quality. Just ask, in your own words. Ask about one room or your whole portfolio at once, run deep analysis and diagnostics, check certification compliance, and more.
CO₂ peaked at 1,480 ppm around 7:40 PM in Conference Room B.
An after-hours all-hands ran ~90 min past the HVAC schedule; ventilation had already ramped down for the night.
Your air quality is genuinely strong and on track for WELL. Here's the realistic WELL projection:
Preconditions — all 4 should pass:
Optimization points — projected 7 of 7:
Here's the monthly IAQ summary built from your 30-day portfolio data:
Monthly IAQ Summary — July 2026 Portfolio
Headline: 3 buildings have persistent, multi-metric failures that need attention this month; 4 buildings are performing at or near excellent across all parameters.
30-Day Performance Stack Rank
| Building | Air Quality % | Thermal Comfort % | CO₂ % Excellent | PM2.5 % Excellent | TVOC % Excellent | Temp % Comfortable | Humidity % Comfortable | Priority |
|---|---|---|---|---|---|---|---|---|
| Courtyard 3 Connector | 53% | 0% | 80% | 25% | 0% | 0% | 0% | Investigate all metrics |
| Lejo House | 67% | 2% | 100% | 1% | 100% | 0%100% too warm | 4%96% too humid | Thermal + PM2.5 failure |
| Josh Test | 59% | 69% | 88% | 15% | 74% | 59% | 79% | PM2.5 & temp needs attention |
| Andu's US Test Building | 70% | 69% | 95% | 30% | 86% | 38%62% too warm | 100% | Overheating + PM2.5 |
| Kyle's Home | 67% | 100% | 0% | 100% | 100% | 100% | 100% | CO₂ sensor data gap |
| Haywood | 94% | 66% | 100% | 96% | 87% | 49% | 83% | Temperature running warm |
41 of 43 devices are healthy. 2 on Floor 3 dropped below −85 dBm.
The weak devices are clustered near a recently relocated partition wall — likely blocking line of sight to the gateway.
It checks everything you would have, if you had an entire afternoon.
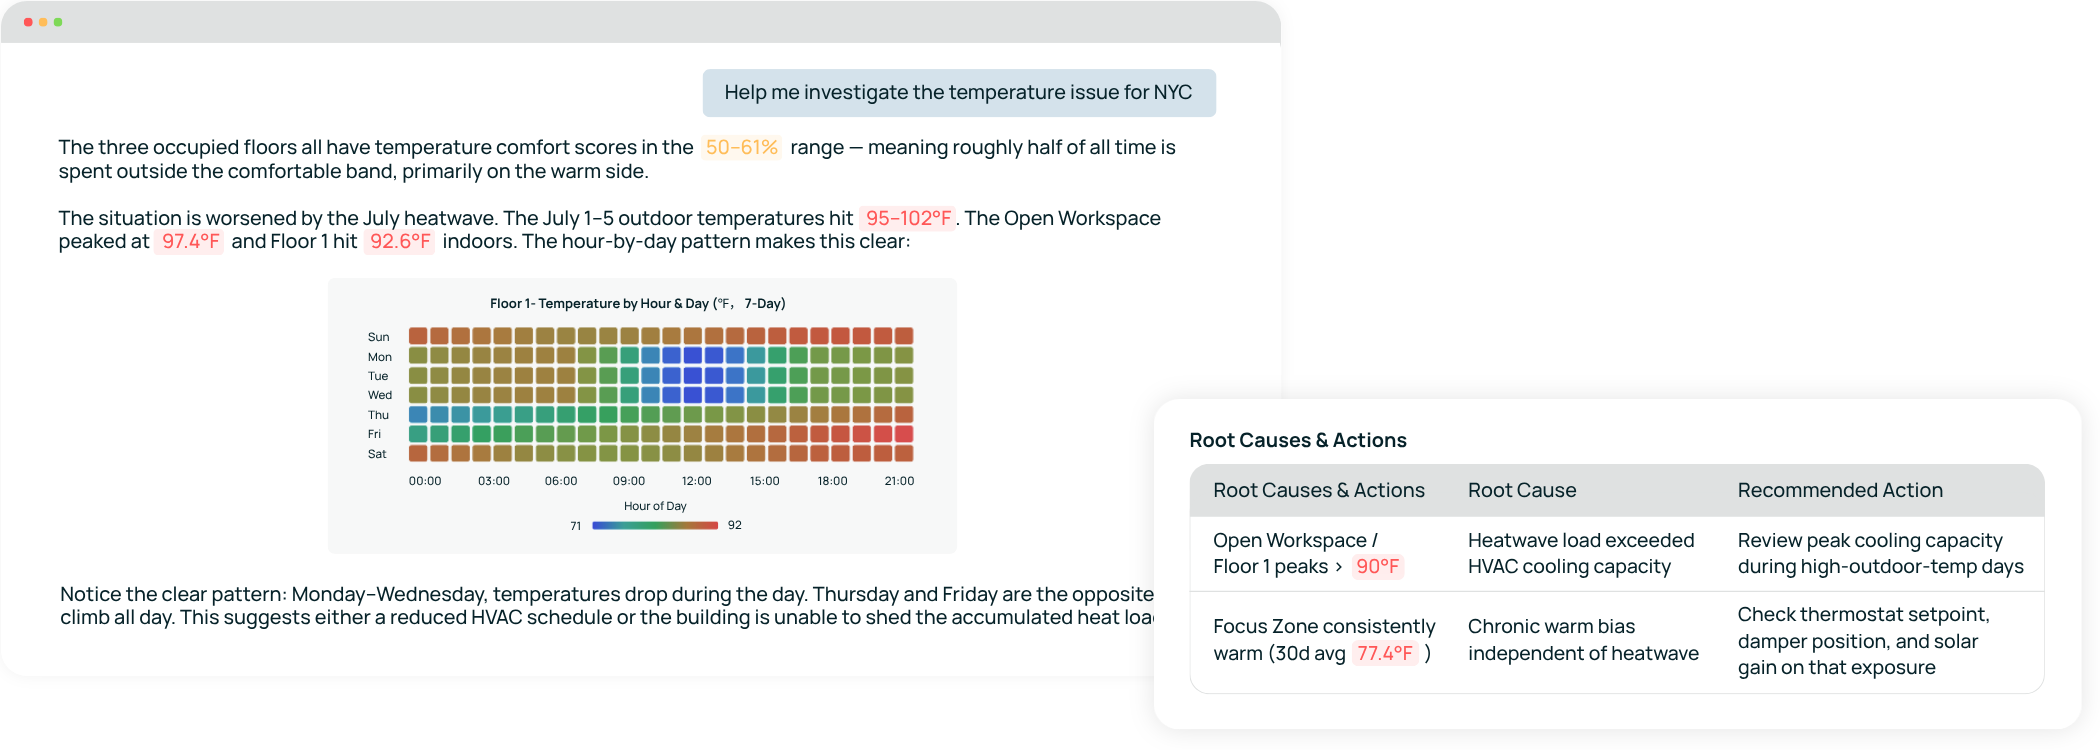
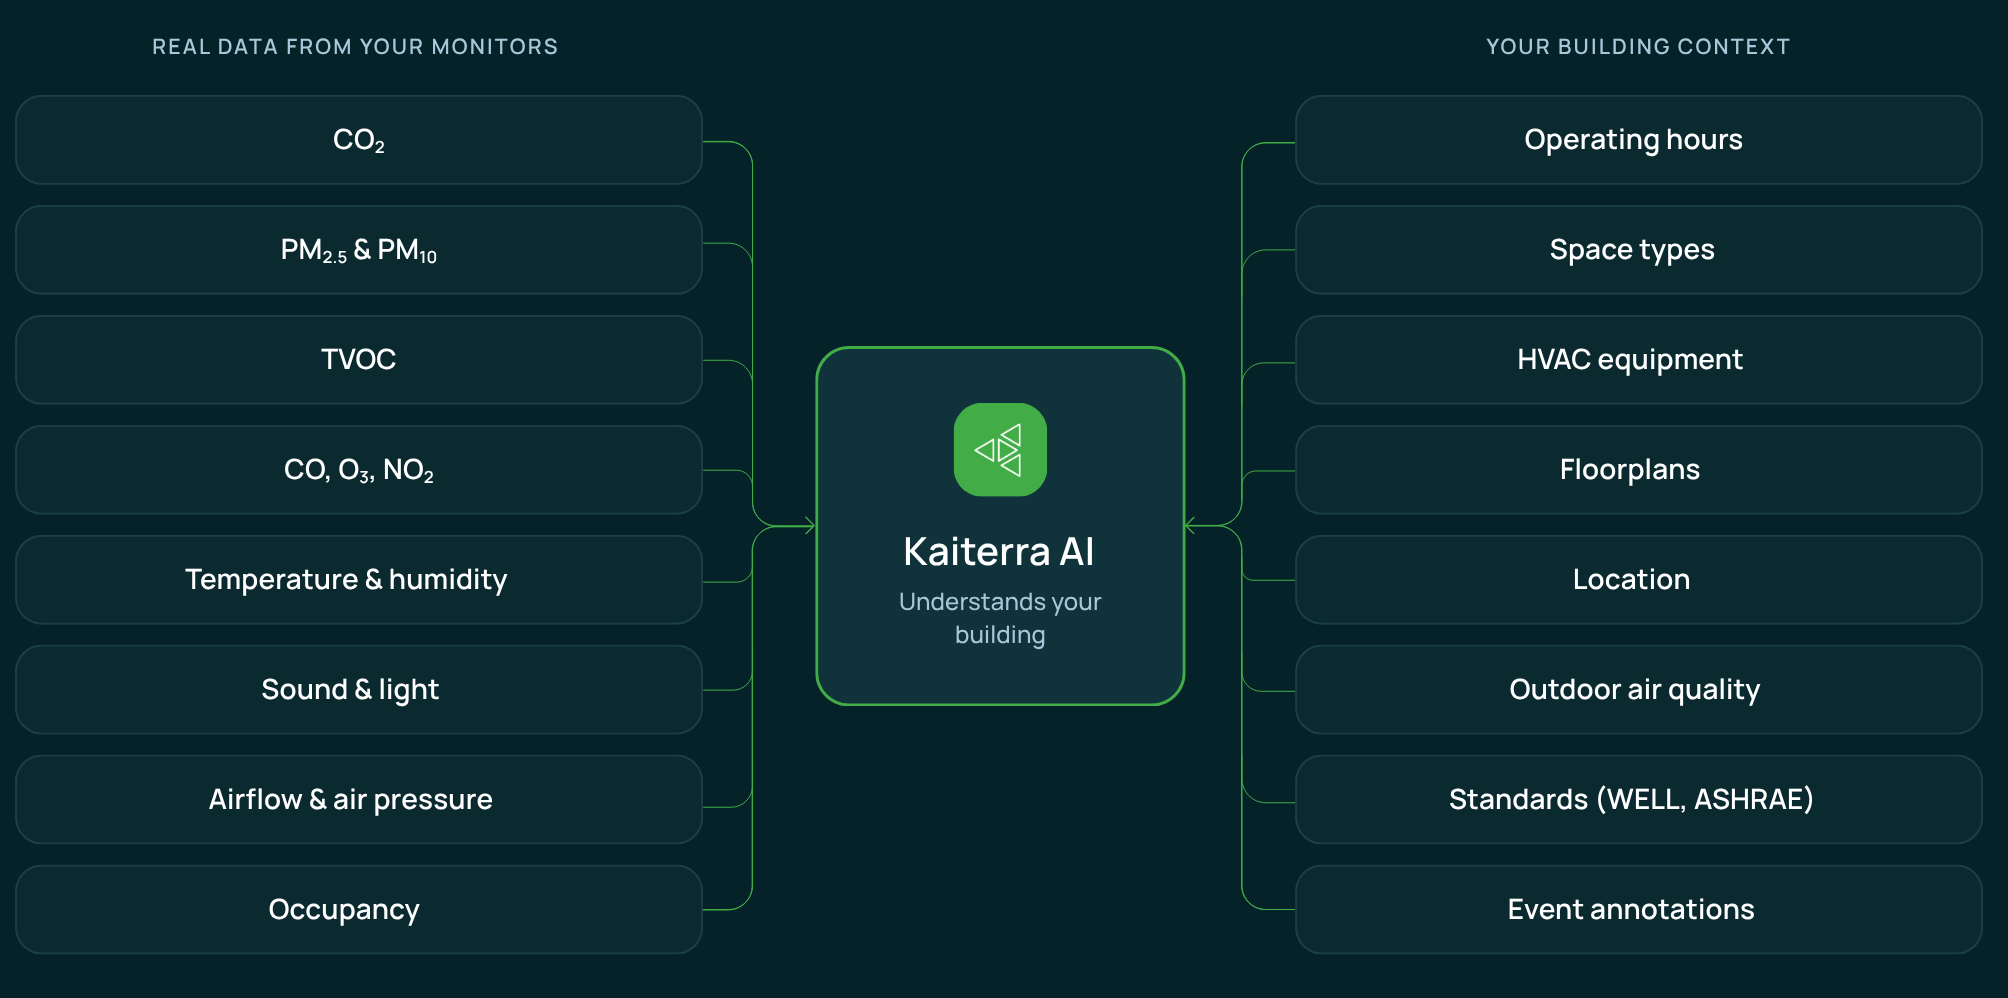
Ask why PM2.5 climbed on the fourth floor and Kaiterra AI goes and looks. Thousands of sensor data points, minute-level readings around the event, the latest outdoor monitoring data, occupancy, your floor plans, and the annotations your team logged months ago. It assembles the full picture before it says a word, then walks you through what it found and why.
Find out what your HVAC is doing when nobody is in the building.
Ask when your air handlers actually run, and Kaiterra AI answers from sensor evidence instead of the BMS schedule on file. It investigates occupancy patterns, reads supply air from duct sensors, and flags the gaps: conditioning empty floors, ramping up an hour too late, or running filtration that no longer matches room conditions. Every mismatch is a line item you can take to facilities.
Know where you stand on WELL before the audit does.
Ask how a building is tracking against the WELL v2 Air Concept and Kaiterra AI reads your live sensor data against the thresholds that matter. It separates real issues from connectivity gaps, covers the pollutants that carry optimization points, and shows you which spaces are at risk while there is still time to act. Cross-reference the findings against your WELL Compliance Report before submission.
Tell it once. It knows from then on.
Drop in mechanical drawings, engineering letters, commissioning reports, or a photo of the room. Kaiterra AI reads them alongside live sensor data, so it reasons about your actual airflow, capacity, and materials instead of readings alone. Log an event once, like weekly cooking in the cafeteria, and it factors that into every future analysis. Context is shared across everyone in the building, so the tool gets better for the whole team.
Built to understand your building.
See Kaiterra AI in action
See what you can ask.
Real questions from real people. Tap any tile to see how Kaiterra AI answers it.
Less time clicking.
More time deciding.
Getting an answer used to take multiple clicks. Now you just ask, and spend your time deciding what to do instead of hunting for the right chart.
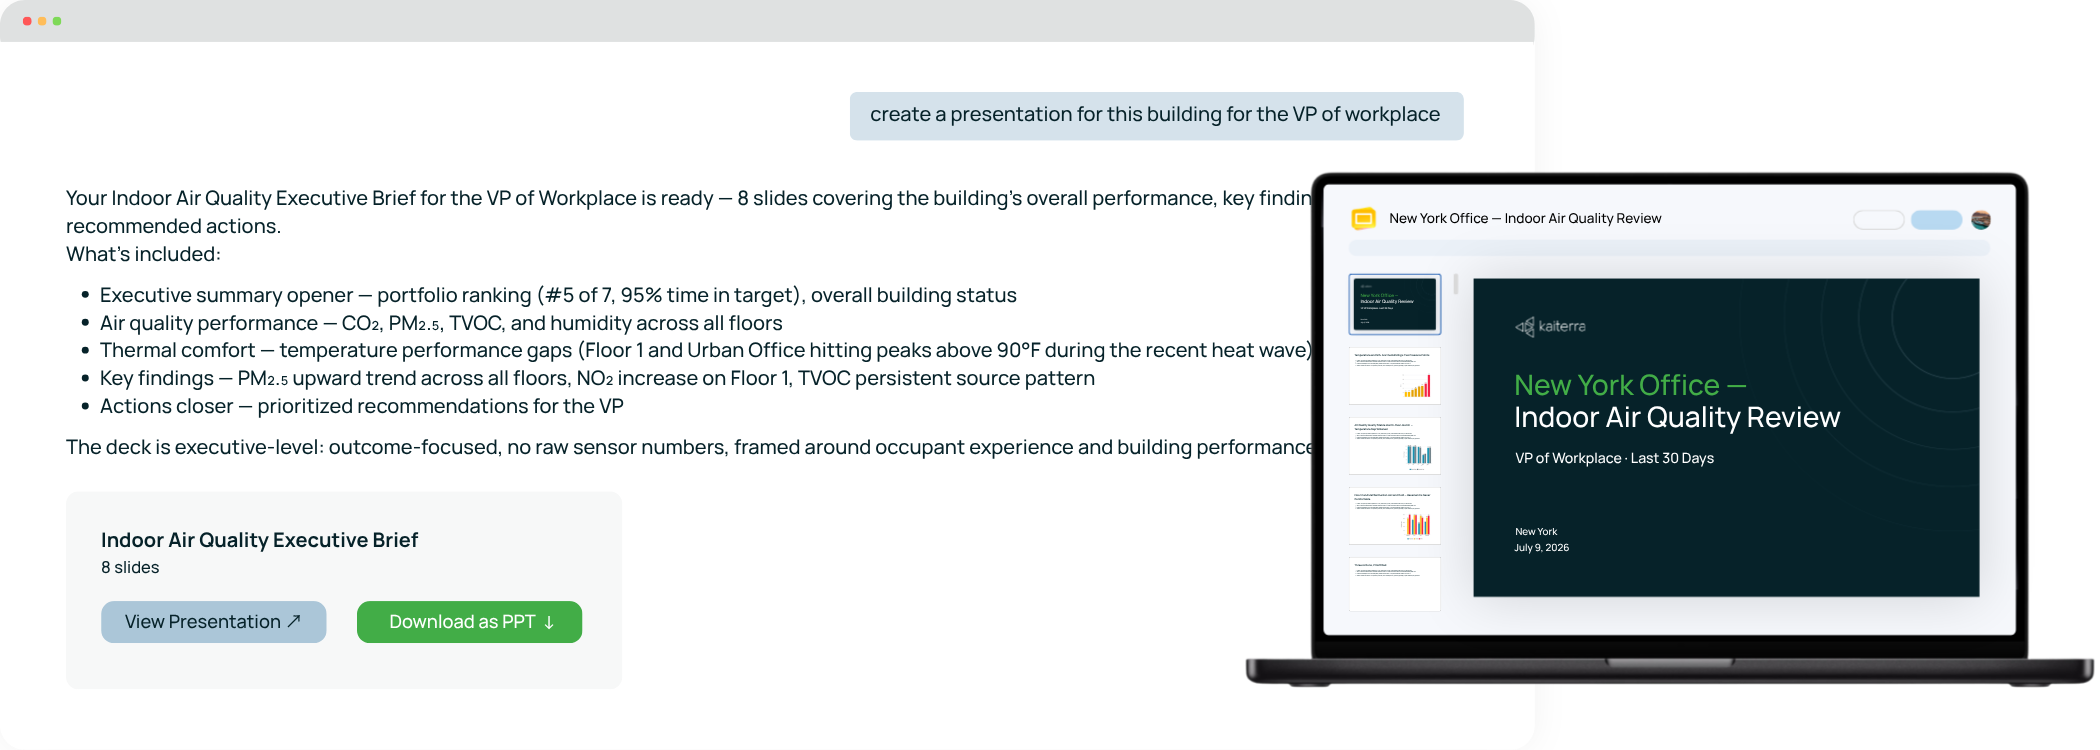
Charts, talking points, and slides come out ready to drop into your report or deck. No more manual screenshotting.
Stay ahead of the changes that matter. Problems surface, get explained, and get addressed before they become complaints.
Your AI sees exactly what you see. Nothing more, nothing less.
Kaiterra AI doesn't get special access to your data. It gets your access. Every question is answered using your own login session, governed by the same role-based permissions as the rest of your Kaiterra data platform. If you can't see a building, neither can the AI.
Frequently asked questions
Kaiterra AI is reliable for the questions it's built to answer: diagnostics, reporting, compliance checks, and event investigations against your own data. Every answer cites the underlying data points and the calculation behind them, so you can verify before acting.