




.png?width=200&height=148&name=Menu%20C%20(2).png)
.png?width=307&height=228&name=Menu%20-%20D%20(1).png)





.png)



You have the data. Getting answers shouldn’t be this hard.
You have the data. Getting answers shouldn’t be this hard.


.svg)
Closing the loop for building performance, simply by chatting
Understand, diagnose, report, and share, all in a single conversation. Issues get resolved faster, your team gets support, and occupant experience improves.
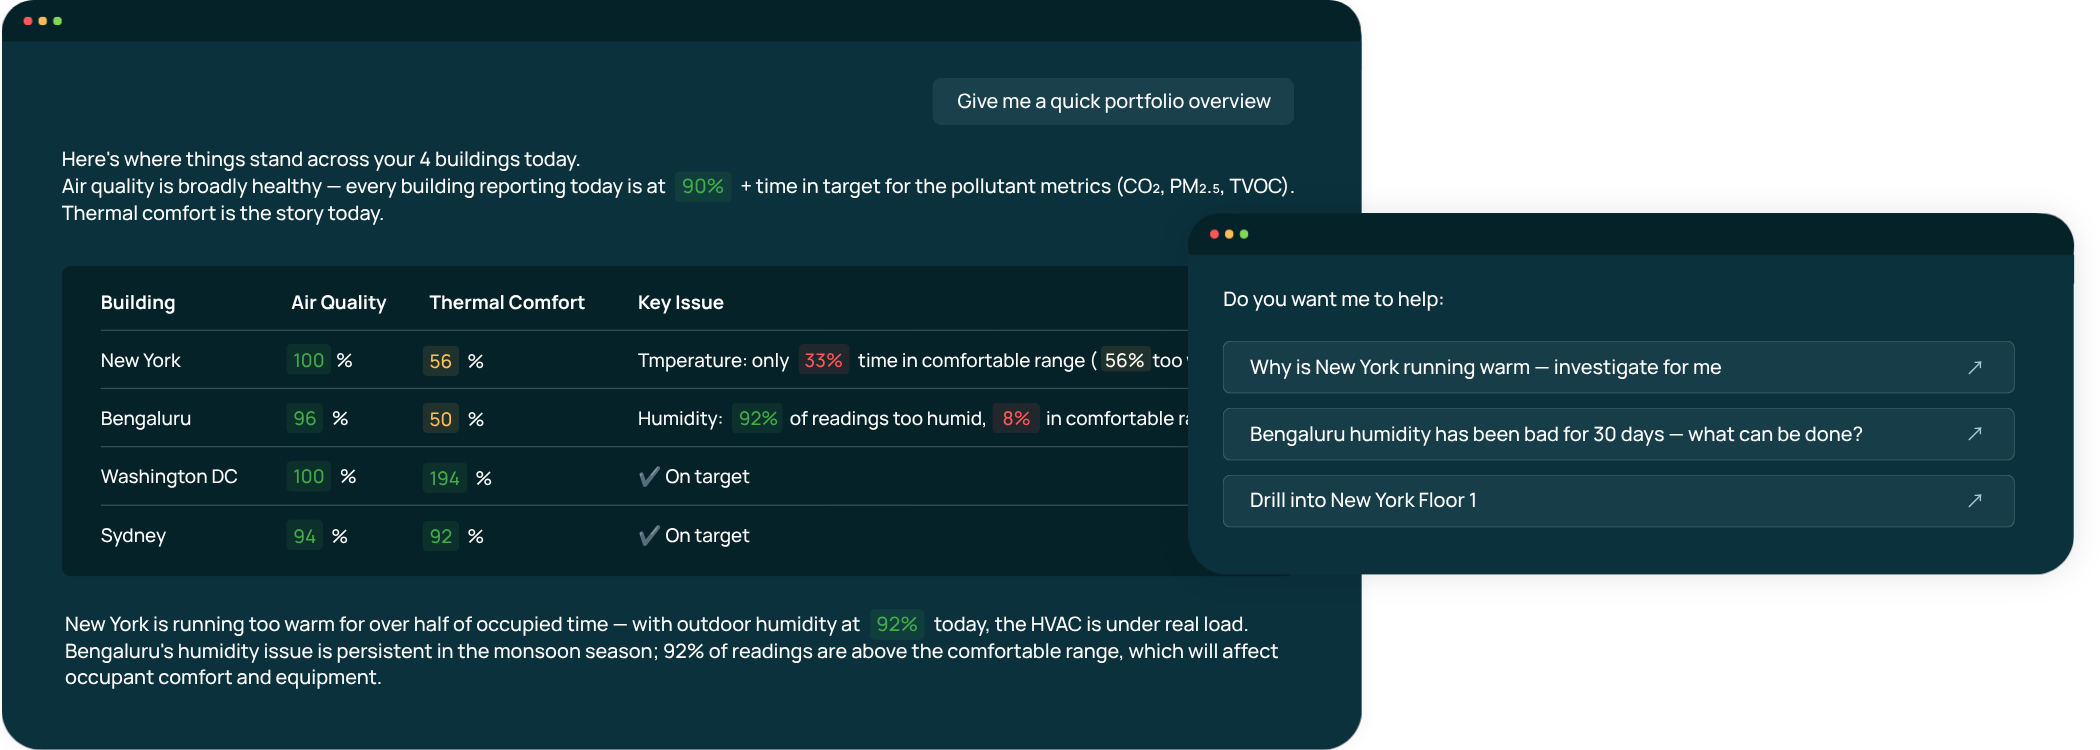
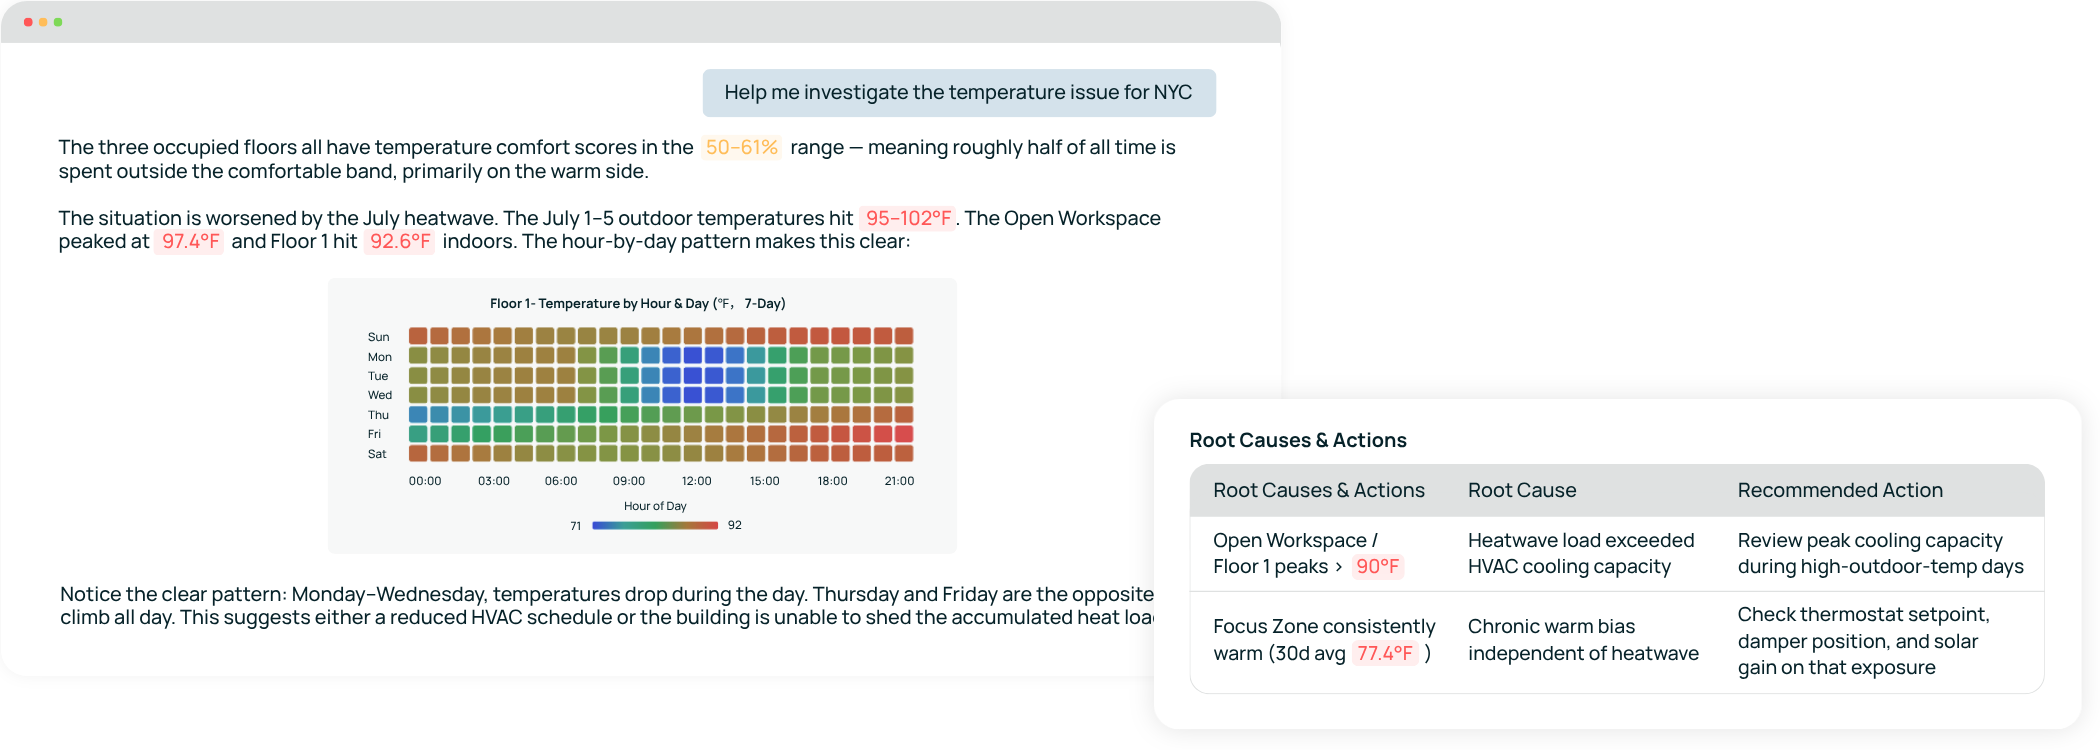
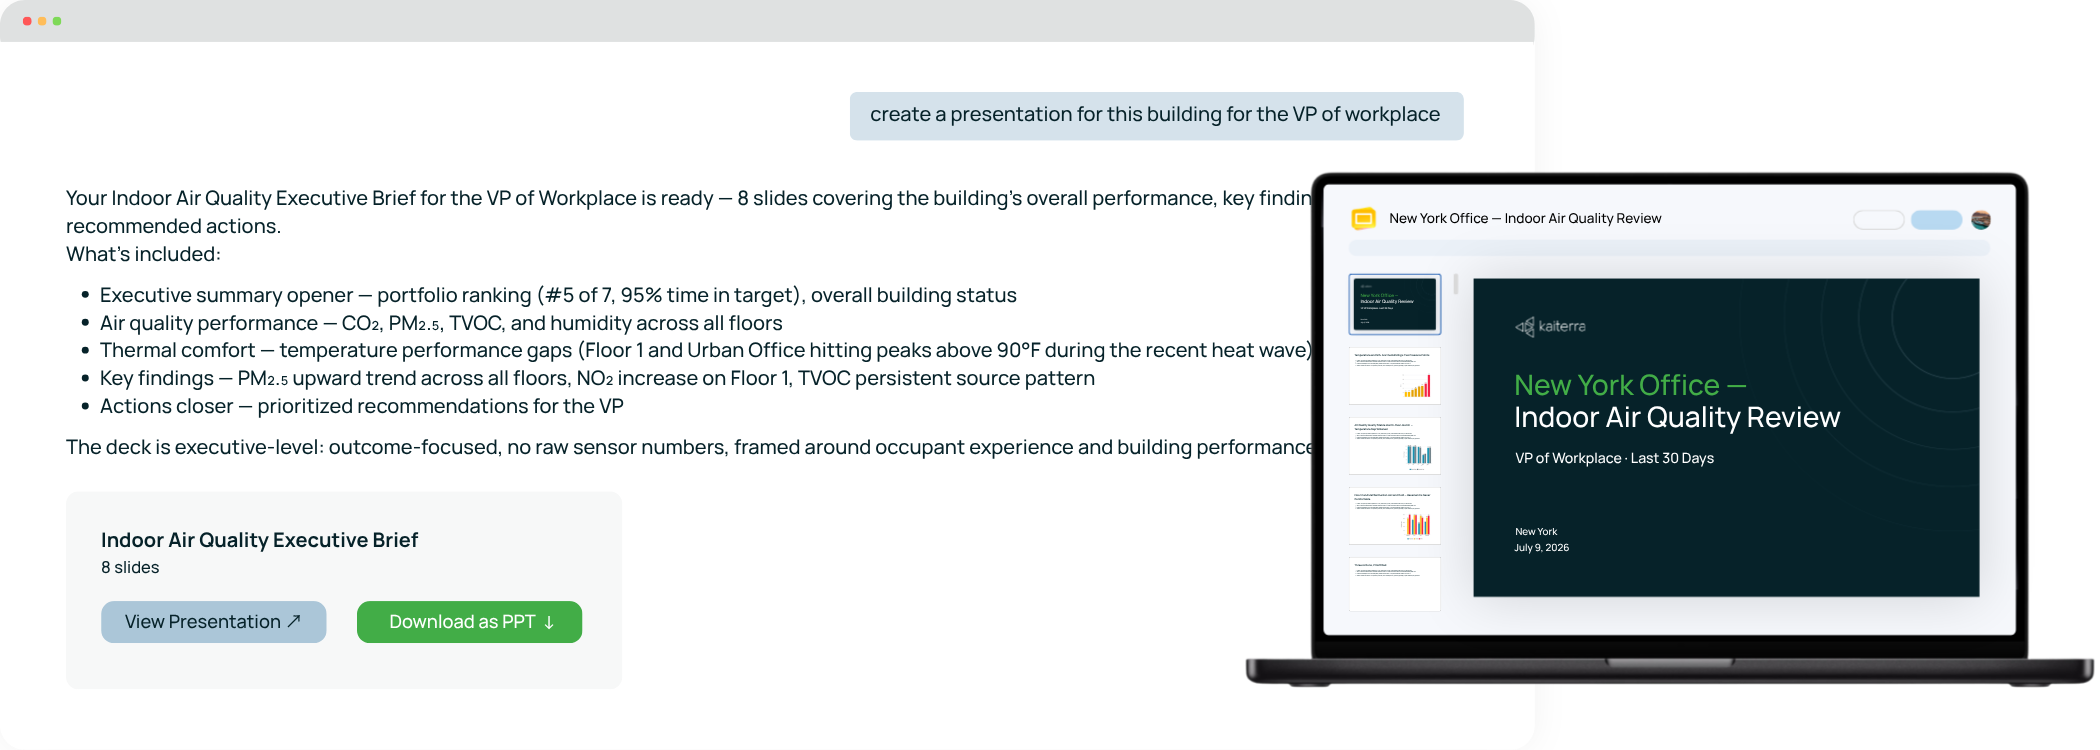
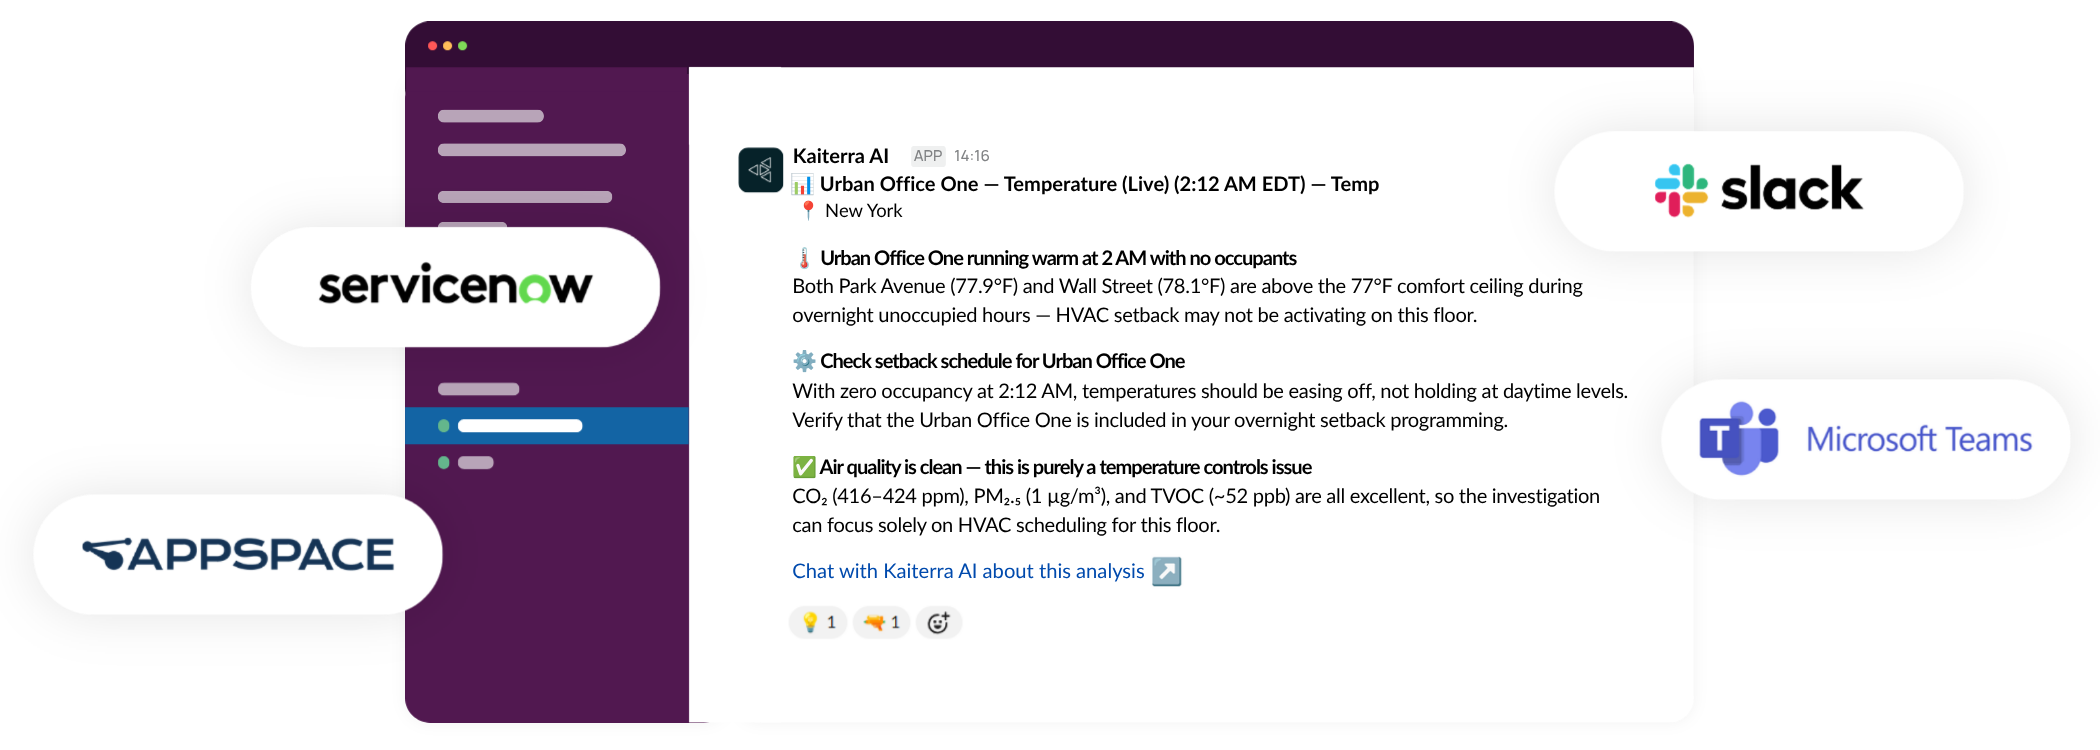
See Kaiterra AI in action
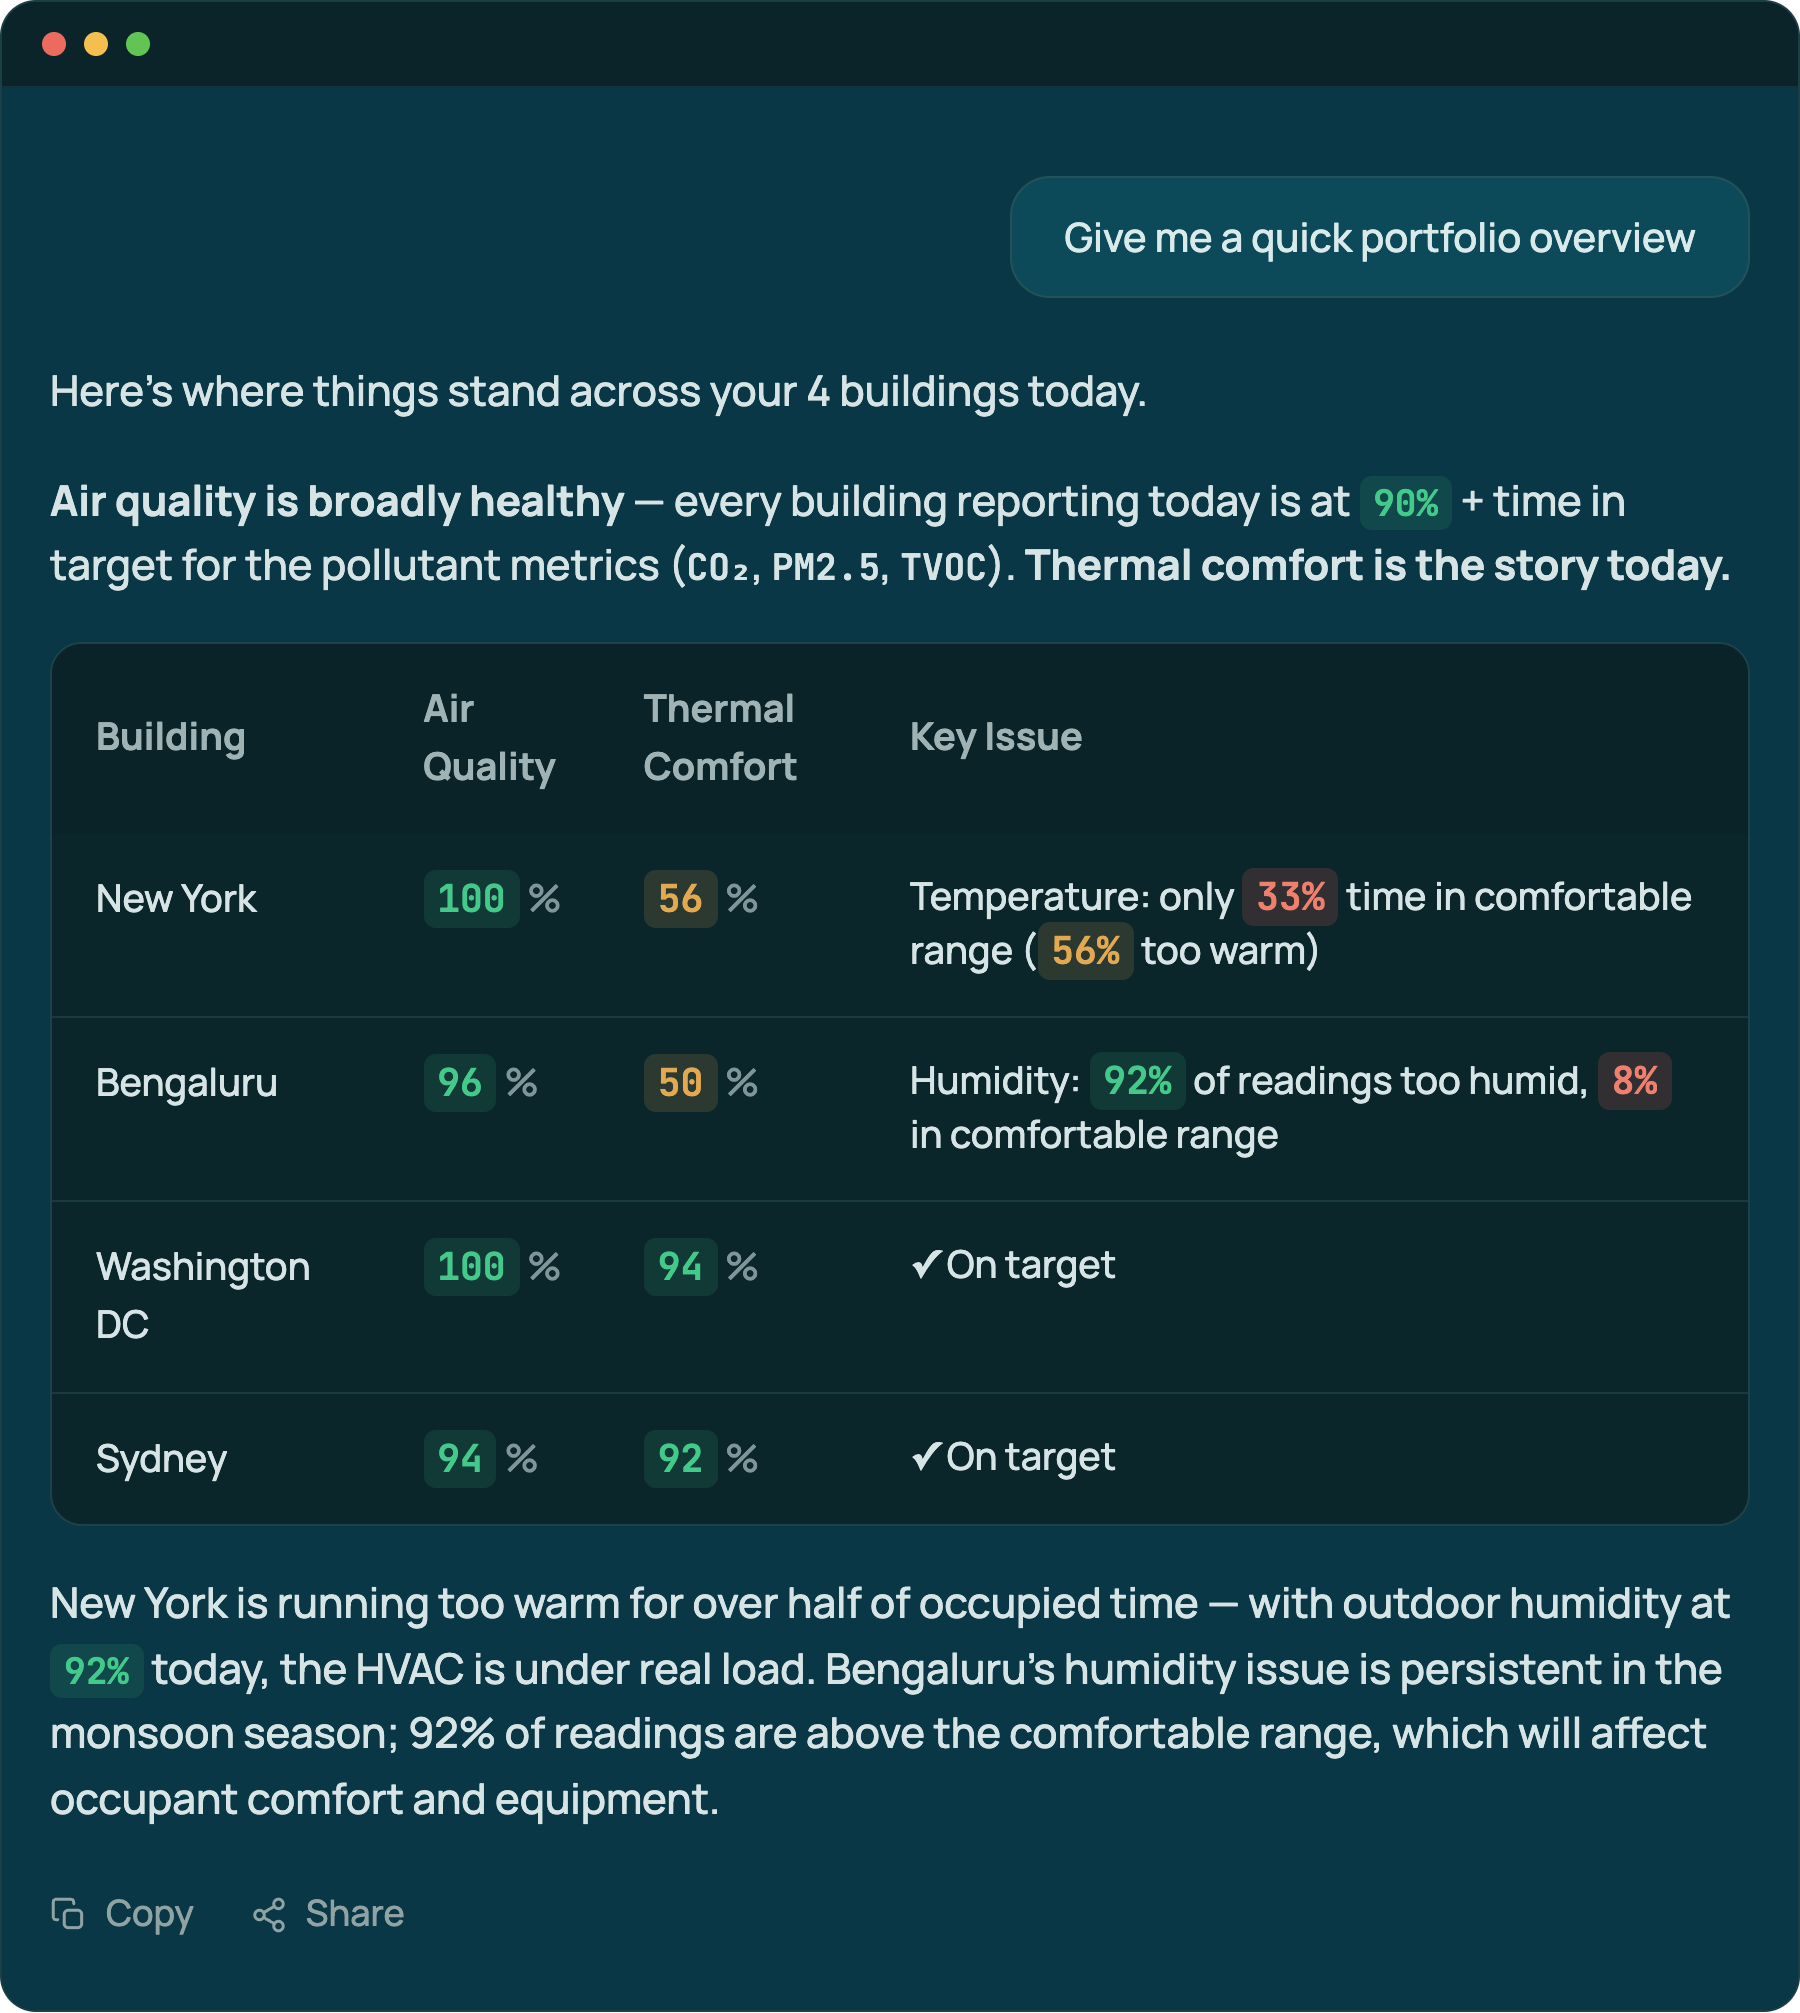
You don't have to toggle filters and tabs to know your air quality. Just ask, in your own words. Ask about one room or your whole portfolio at once, run deep analysis and diagnostics, check certification compliance, and more.
CO₂ peaked at 1,480 ppm around 7:40 PM in Conference Room B.
An after-hours all-hands ran ~90 min past the HVAC schedule; ventilation had already ramped down for the night.
Your air quality is genuinely strong and on track for WELL. Here's the realistic WELL projection:
Preconditions — all 4 should pass:
Optimization points — projected 7 of 7:
Here's the monthly IAQ summary built from your 30-day portfolio data:
Monthly IAQ Summary — July 2026 Portfolio
Headline: 3 buildings have persistent, multi-metric failures that need attention this month; 4 buildings are performing at or near excellent across all parameters.
30-Day Performance Stack Rank
| Building | Air Quality % | Thermal Comfort % | CO₂ % Excellent | PM2.5 % Excellent | TVOC % Excellent | Temp % Comfortable | Humidity % Comfortable | Priority |
|---|---|---|---|---|---|---|---|---|
| Courtyard 3 Connector | 53% | 0% | 80% | 25% | 0% | 0% | 0% | Investigate all metrics |
| Lejo House | 67% | 2% | 100% | 1% | 100% | 0%100% too warm | 4%96% too humid | Thermal + PM2.5 failure |
| Josh Test | 59% | 69% | 88% | 15% | 74% | 59% | 79% | PM2.5 & temp needs attention |
| Andu's US Test Building | 70% | 69% | 95% | 30% | 86% | 38%62% too warm | 100% | Overheating + PM2.5 |
| Kyle's Home | 67% | 100% | 0% | 100% | 100% | 100% | 100% | CO₂ sensor data gap |
| Haywood | 94% | 66% | 100% | 96% | 87% | 49% | 83% | Temperature running warm |
41 of 43 devices are healthy. 2 on Floor 3 dropped below −85 dBm.
The weak devices are clustered near a recently relocated partition wall — likely blocking line of sight to the gateway.
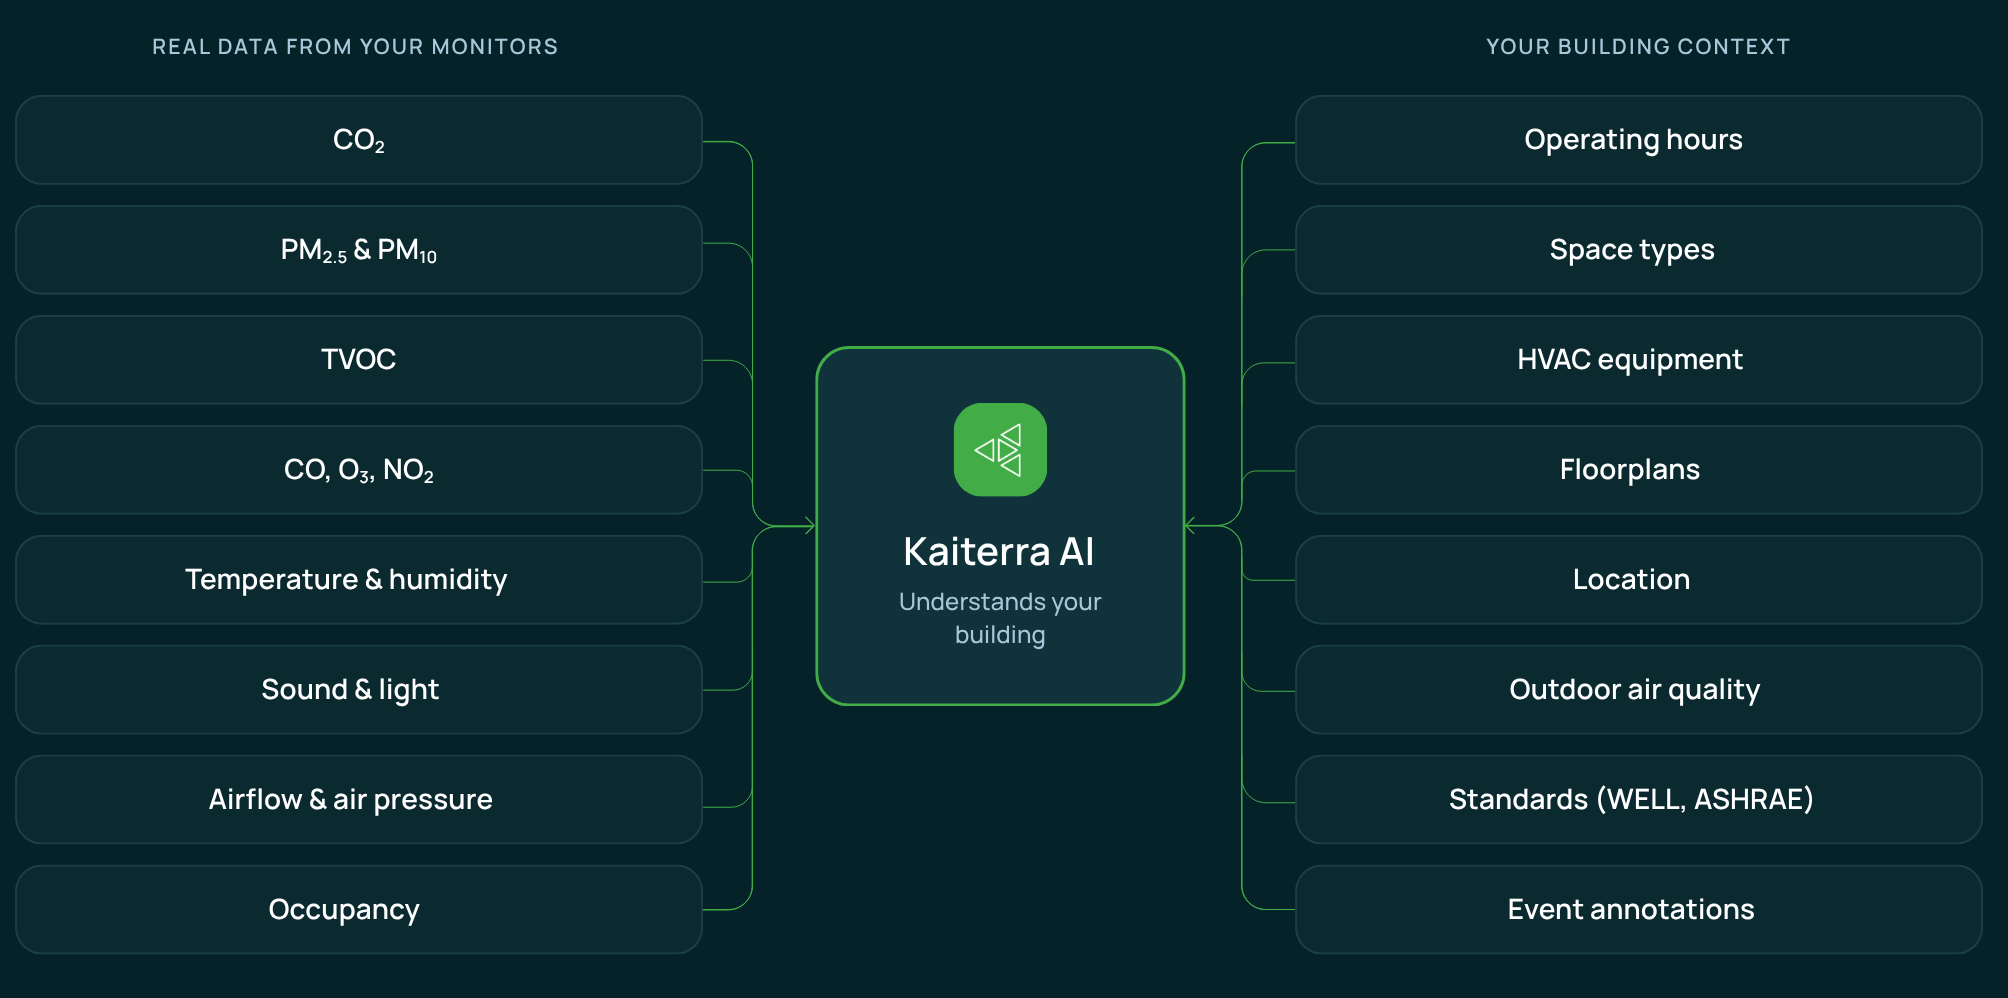
Built to understand your building.
See Kaiterra AI in action

Your AI sees exactly what you see. Nothing more, nothing less.
Kaiterra AI doesn't get special access to your data. It gets your access. Every question is answered using your own login session, governed by the same role-based permissions as the rest of your Kaiterra data platform. If you can't see a building, neither can the AI.


